Considering YouTube is owned by Google, it’s no surprise that it leads the way for music discovery. As a Symphonic client, you get easy access to analytics right in the SMS. In this post, we’ll break down exactly how to do it. 👀
How To Access Our YouTube Analytics Feature in the SMS
Here’s the rundown…
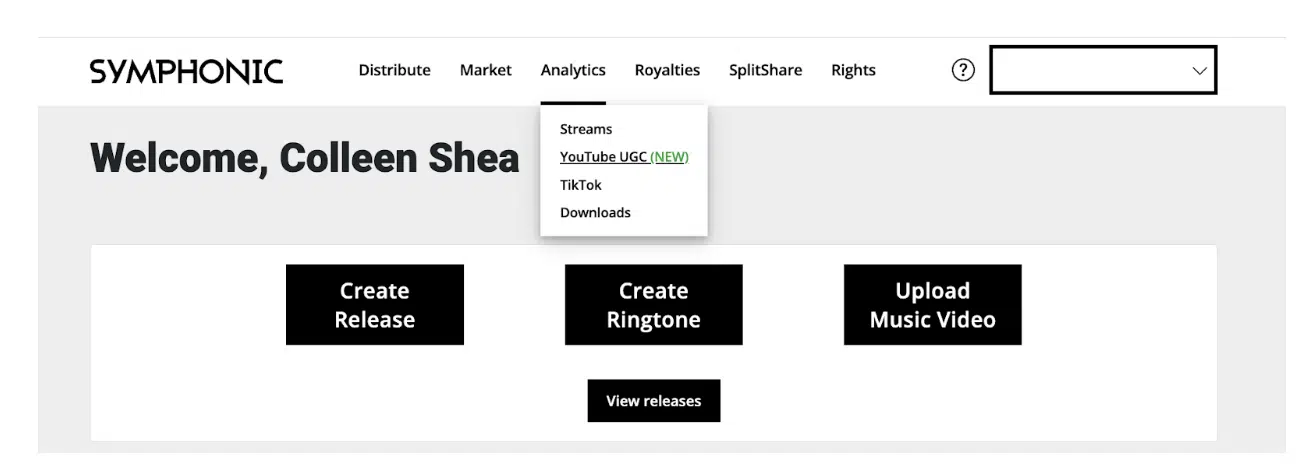
Symphonic’s YouTube User-Generated-Content (UGC) analytics provides our clients with detailed information on how their content is being used in UGC videos all across YouTube, at no extra cost. This new analytics feature has information on UGC Views, Watch Time and videos created using your content. — Here’s how to find it:
- Log in to the SMS.
- Next, click on Analytics > YouTube UGC.
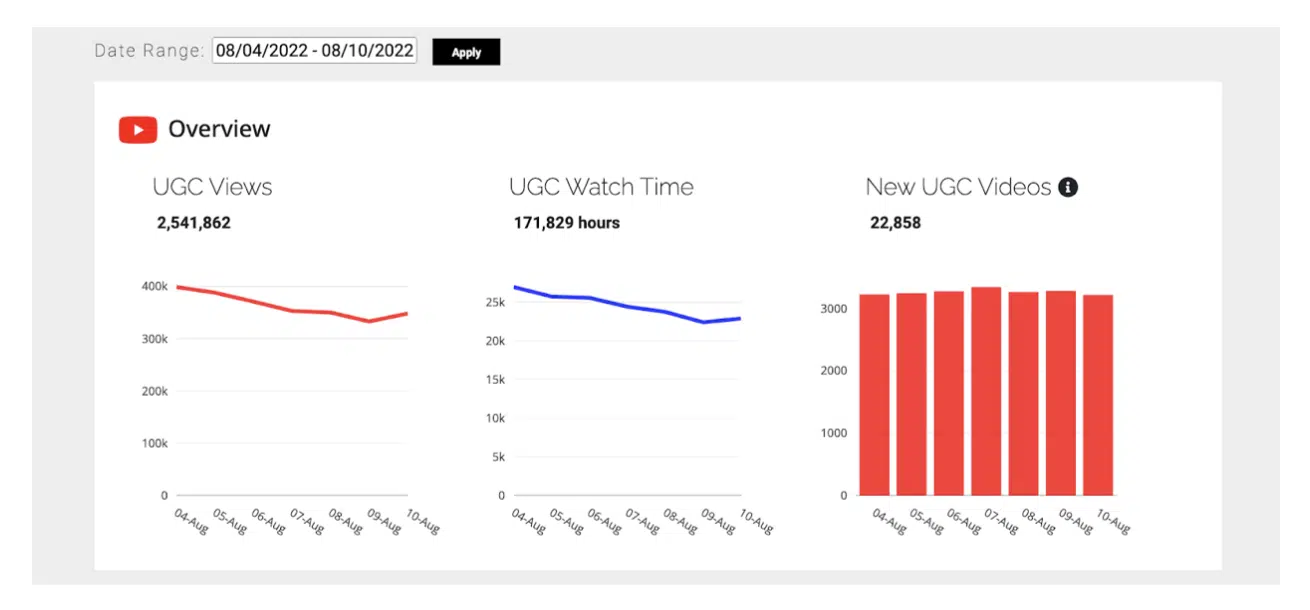
The landing page provides a view of performance across your entire catalog on a selectable date range. The page is broken down into the following sections:
Overview
The overview card shows three metrics for your entire catalog for the selected date range:
- UGC Views. The number of views of UGC videos that use your music. YouTube UGC royalties are based on views.
- UGC Watch Time. The total watch time of UGC videos that use your music. Longer watch times lead to an increase in royalty rates.
- New UGC Videos. The number of new UGC videos that were uploaded to YouTube and claimed via Content ID.
By hovering over each graph, you can see the relevant metric for each individual day.
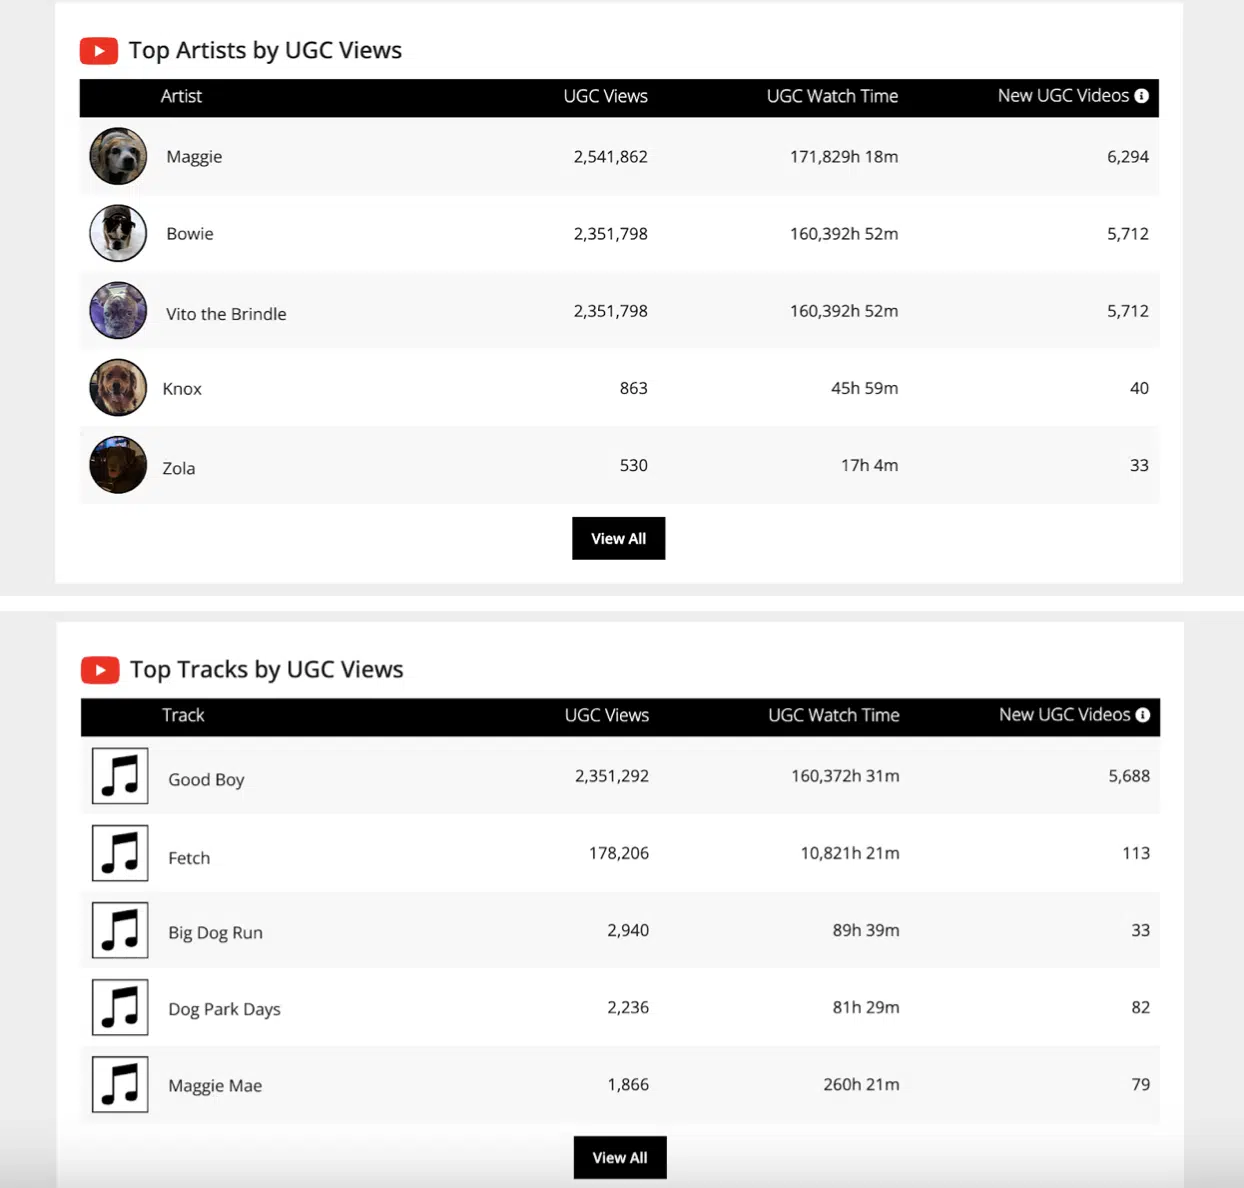
Top Artists and Tracks by UGC Views
These two sections show the UGC Views, UGC Watch Time, and New UGC Videos for both artists and tracks. Each section shows the top five entries by UGC Views, but you can see all artists and tracks in your catalog by clicking the View All button in the relevant section.
Top UGC Videos by Views
This section displays the top UGC videos by views for the selected time period, additional details about the video, and relevant metrics, including:
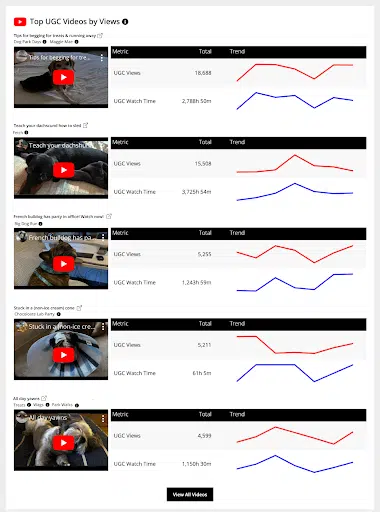
- The embedded UGC video that can be played directly in SymphonicMS
- The video name
- The list of tracks used in the video
- An open icon to view the video on YouTube
- The total number of UGC Views for the selected time frame
- A sparkline of UGC Views showing the trend for the selected timeframe
- The total UGC Watch Time for the selected time frame
- A sparkline of UGC Watch Time showing the trend for the selected timeframe
By hovering over the information icon next to the track name, you will see the primary artist for that track. By hovering over the sparkline, you can see the relevant metric for a particular day.
To see all UGC videos that use your music, just click the View All button.
Top Territories by UGC Views
The last section displays the top five territories by UGC Views in the table. The table also provides data on the UGC Watch Time for those territories.
To view metrics for all territories, click the View All button.
The map is color coded by UGC Views where the darkest hue indicates the most views. To view the map by UGC Watch Time, just use the toggle buttons.
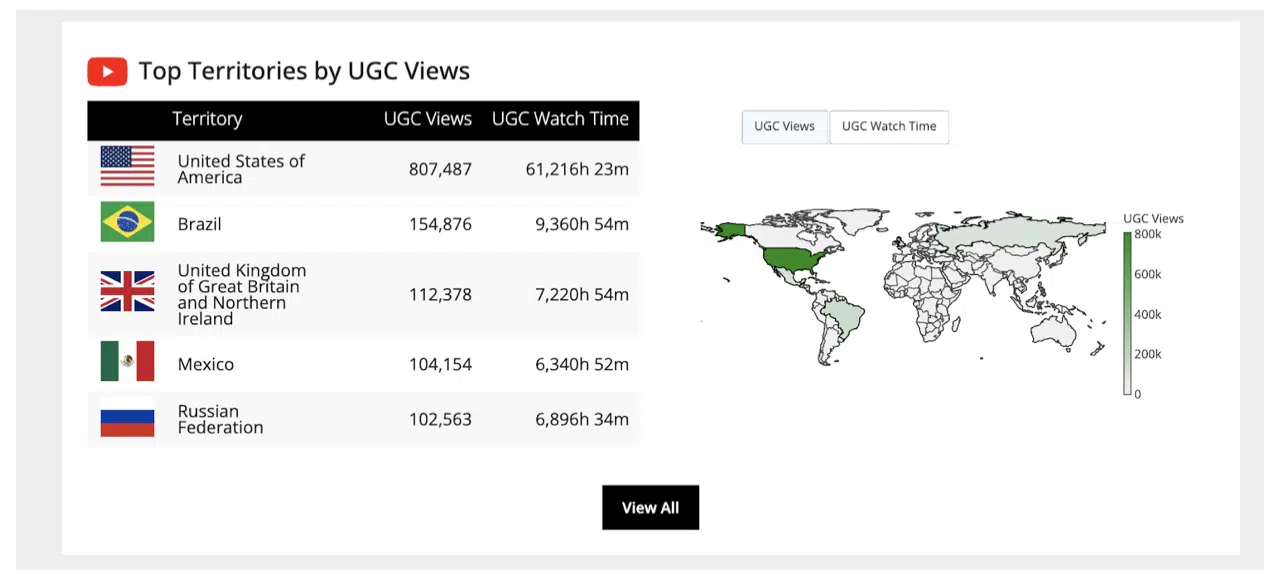 Note: Data regarding New UGC Videos is not available by territory at this point.
✨Keep in mind: YouTube UGC Analytics are only available to clients who are enrolled in Content ID, which is a YouTube system that scans uploaded content and identifies your music to monetize. For more information about enrolling in Content ID, click here.
This is a new feature we just launched recently, and we’re stoked to finally be able to offer it! We hope you enjoy it as much as we do.
——
Want to learn even more? 🧠
How To Get More Views on YouTube as a Musician
5 Things You Should Know About YouTube Royalties
Posting a YouTube Link vs Directly Uploading Videos to Facebook
Organic YouTube Marketing Basics for Musicians
——
In Conclusion…
With everything you do online, you should always have a strategy backing your efforts. By learning from your existing content’s performance, you can take note of what’s working and what isn’t. Then, you can adjust as you go along to improve your efforts in the future.
Good luck! 👏


